How does the peak detection in FC-GP work?
The peak detection algorithm used in FC-GP can be explained using the figure below. The red color is the signal, and the blue color is the derivative of the signal (basically a slope at that moment). The axis on the left is shown in the units of the derivative. For illustration, there are two green vertical lines at 2 and -2 (let us assume the slope has a start value of 2 and an end value of 2).
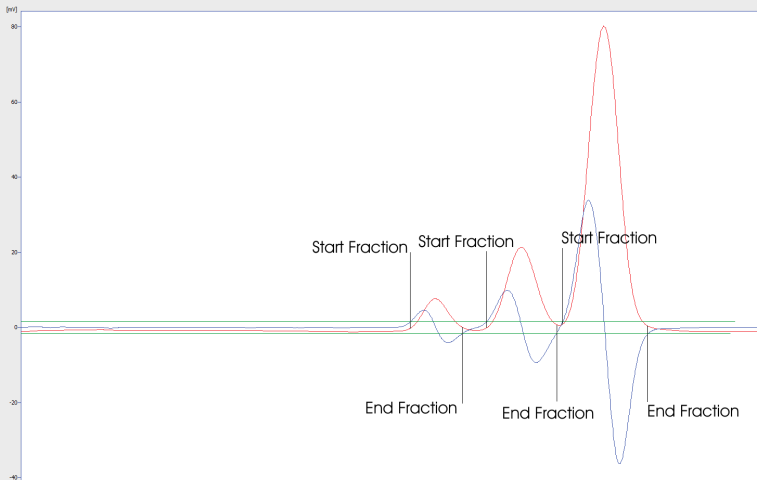
The first peak is collected when the derivative raises over limit 2 (first upward black line). The peak is collected through the peak apex (even before the derivative falls below 2) and is still collected when the derivative falls below -2. Then, it rises, and the peak-end is triggered when the derivative increases from some -4 above -2 (which is the negative of the end limit). If the derivative on the peak-end never falls below -2, the fraction will never end (until the end of the collection interval).
29.10.2015